School Results and Performance Tables
A Strong Three-Year Trend of Excellence
At Beam County Primary School, we are proud to share that our performance over the past three years has demonstrated a clear and sustained upward trajectory across key measures, reinforcing our long-standing commitment to ensuring that every pupil achieves highly.
Progress and attainment in Key Stage 2
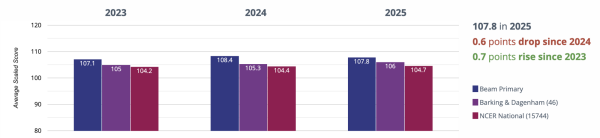
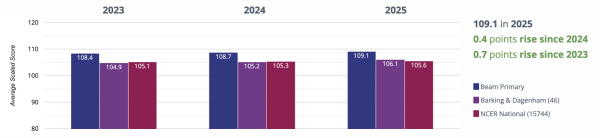
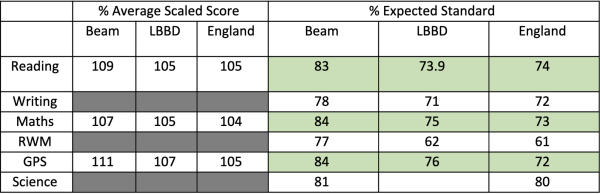
The data below shows that our pupils’ average scaled score has risen considerably - well above both the local authority and national figures.
KS2 Grammar, Punctuation & Spelling (GPS) - average scaled score

KS2 Mathematics - average scaled score
KS2 Reading - average scaled score
This places our school in:
- the top 10 % nationally for progress in reading, and
- the top 12–13% nationally in writing and maths.
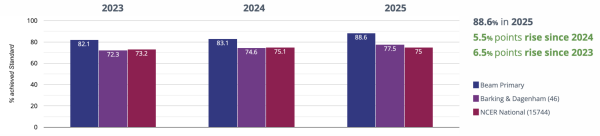
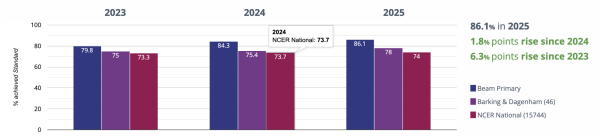
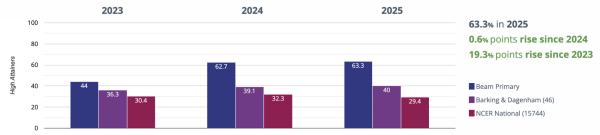
Year 6 (KS2) Pupils achieving the expected standard
The percentage of pupils achieving the expected standard in reading, writing and maths at KS2:
Reading
Writing

Mathematics
Reading, Writing and Mathematics achieved the expected standard
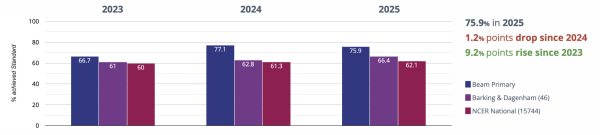
At Beam, this important comparative measure shows that we
- increased from 66.7 % in 2023
- increased to 77.1 % in 2024,
- then consolidated at 75.9 % in 2025
As the blue bar chart shows, this sustained level remains significantly above the borough and national averages.
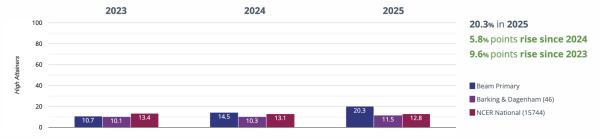
Year 6 Pupils achieving at a higher standard
The figures below show that not only are our pupils meeting high standards, but many are exceeding them.
Mathematics

Reading
Writing
Grammar, Punctuation & Spelling
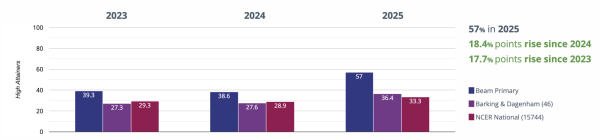
Combined Reading, Writing and Mathematics - Higher attainers
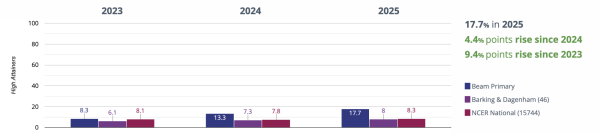
The proportion of pupils achieving the higher standard increased from 8.3 % in 2023 to 13.3 % in 2024, and further to 17.7 % in 2025, showing strong upward momentum and our success in extending deeper learning and challenge at Beam.
Early Years Foundation Stage (EYFS) – A Strong Start for Every Child
At Beam County Primary School, our Early Years provision gives children the strongest possible start to their education. Our curriculum is ambitious, language-rich and carefully sequenced, ensuring children develop the firm foundations they need for future learning.
Over the last three years, our outcomes have consistently shown a strong trend, demonstrating the impact of our teaching, environment, and pastoral care. Children make excellent progress from their individual starting points, and our carefully structured approach ensures that no child falls behind.
At Beam County Primary School, your child gets an excellent start to their education. One of the key national measures for Early Years is the Good Level of Development (GLD). A child is considered to have achieved a GLD if they meet the expected standard in the prime areas of learning (communication and language, personal/social/emotional development, and physical development) and key early literacy and maths skills.
The graphs above show our GLD outcomes over the last three years compared with both the Barking & Dagenham average and the national picture.
Good Levels of Development
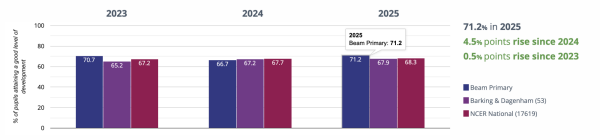
What the data shows
1. Beam children achieve above national levels
In 2025: 71.2% of Beam children achieved a Good Level of Development, compared with 68.3% nationally.
This means children at Beam get a stronger start than children nationally.
2. Our results have risen significantly since last year
GLD rose from 66.7% in 2024 to 71.2% in 2025
This is a 4.5-percentage-point increase in just one year, demonstrating the impact of high-quality teaching, targeted early interventions, and a well-sequenced curriculum.
3. Our performance is stable and consistently strong
Across three years:
2023: 70.7%
2024: 66.7%
2025: 71.2%
Despite national volatility in Early Years outcomes, Beam has maintained a strong and secure upward trend, rising again in 2025 and remaining consistently above national standards.
4. Beam performs above the local authority
Compared with Barking & Dagenham schools:
Beam is 3.3 percentage points higher than the borough average (67.9%).
This reflects our firm commitment to language development, early reading, early mathematics, and personal development.
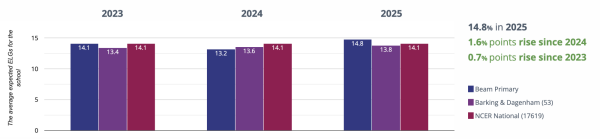
Average Number of Early Learning Goals at Expected Level per Child
What this means for your child
A strong start
These results show that children at Beam:
- develop key early reading, speaking, and number skills securely
- grow in confidence, curiosity and independence
- are well prepared for the transition into Year 1
- High-quality teaching and support
Our success reflects:
- a carefully designed Early Years curriculum
- skilled teaching that develops vocabulary and critical thinking
- effective support for children with SEND
- strong home–school partnerships
- daily opportunities for purposeful play and exploration
Positive outcomes for all learners
The rising trend also demonstrates that:
- children who need extra help receive timely support
- continuing improvements in early reading, phonics, and early maths are having a measurable impact
- our Early Years provision remains a strength of the school
- we are closing gaps early, ensuring long-term success across later year groups
2023 - 24 Data
Key Stage 1 Assessment Summary 2024

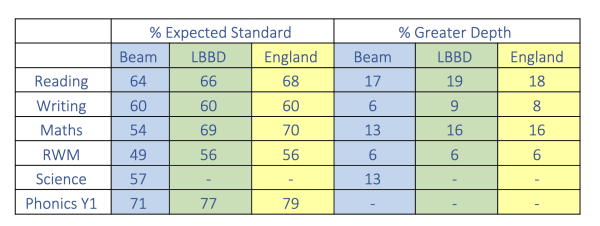
Key Stage 2 SATs Results 2024
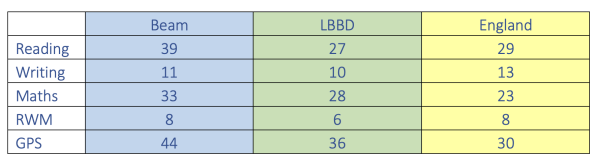
Key Stage 2 SATs Results 2024 - Greater Depth
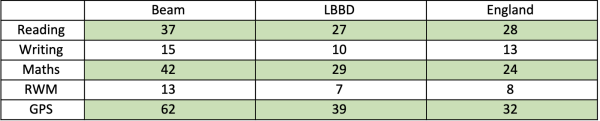
EYFS: Good Levels of Development 2024
![]()
The results below are provisional results for 2022-23. The last available public data is from the 2018 to 2019 academic year.
Key Stage 1 - assessment summary 2023
Key Stage 2
SATs Results 2023
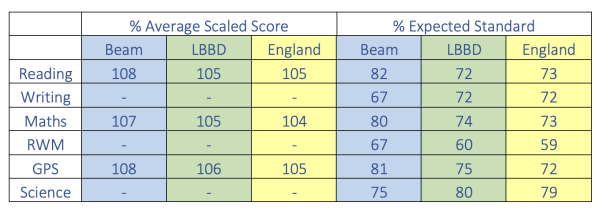
It is important to note that our average scaled score is above all other schools in Barking and Dagenham and England. It demonstrates that our pupils make above average progress from KS1. We are very proud of the exceptional progress that pupils make during their time at Beam.
KS2 Greater Depth 2023
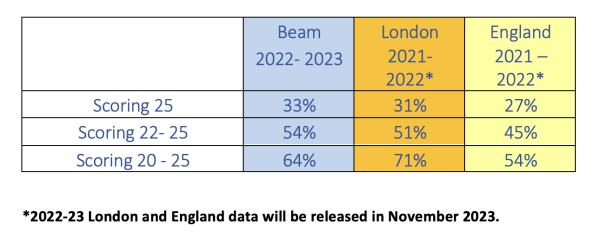
Multiplication Tables Check (Year 4)
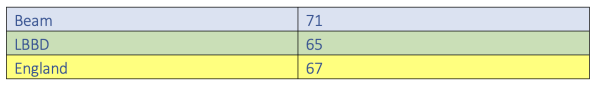
EYFS Good Level of Development
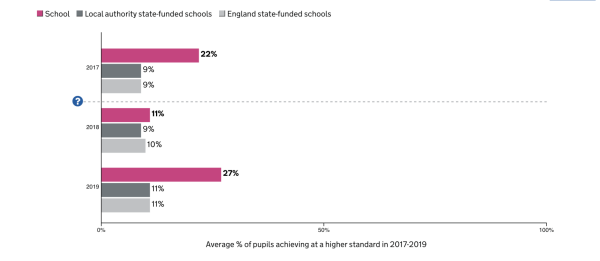
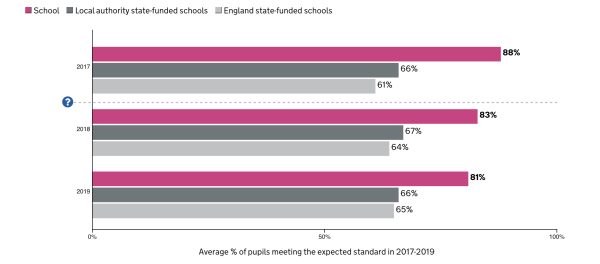
KS2 2018 - 2019 results
Progress Scores
Our progress scores, which are in the top 10% nationally for reading, in the top 12% for writing and the top 13% nationally for maths, show that our pupils make significantly above average progress between KS1 and KS2. Progress in Reading has been ia particular strength for the past three years.
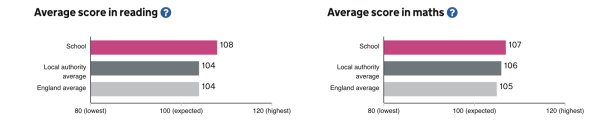
Average Scores
Pupil marks are converted into scaled scores to allow for direct comparison year-on-year. A scaled score of 100 is the ‘expected standard’. The highest possible scaled score is 120. This shows that our average scaled scores are significantly higher than the ‘expected standard’. In particular, we have always had a trend of more pupils working at a higher level nationally.
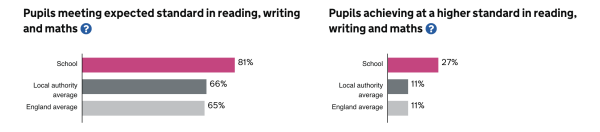
Results over 3 years - Pupils achieving at a higher standard in reading, writing and maths
Results over 3 years - Pupils meeting expected standard in reading, writing and maths
Please press here to be directed to the Beam's performance measure page.